
Software solutions

Interactivity and analytics software solutions for exhibition stands

Boost your stand's impact and footfall, and measure your ROI

Transform your visitors' experience with TwisT, our interactive touch application, and measure the real footfall of your events with A-Loc Analytics, our AI-assisted counting solution.

TwisT: interactive touch media application

An intuitive touch experience that lets your visitors discover your content and your brand on their own

At a trade fair, capturing visitors' attention depends on the clarity and interactivity of your message. TwisT turns any screen, table or touch kiosk into a dynamic showcase that brings together all your communication materials: PDF catalogues, demo videos, websites, 3D visuals, slideshows.

Twist interface - content carousel on a touch display

For the application to become a true extension of your brand, our technical teams integrate your brand guidelines and fully customise the interface. Thanks to an interface designed for instant, intuitive use, your visitors browse your media smoothly and immersively and discover your solutions at their own pace, on a tool that reflects your company's colours.
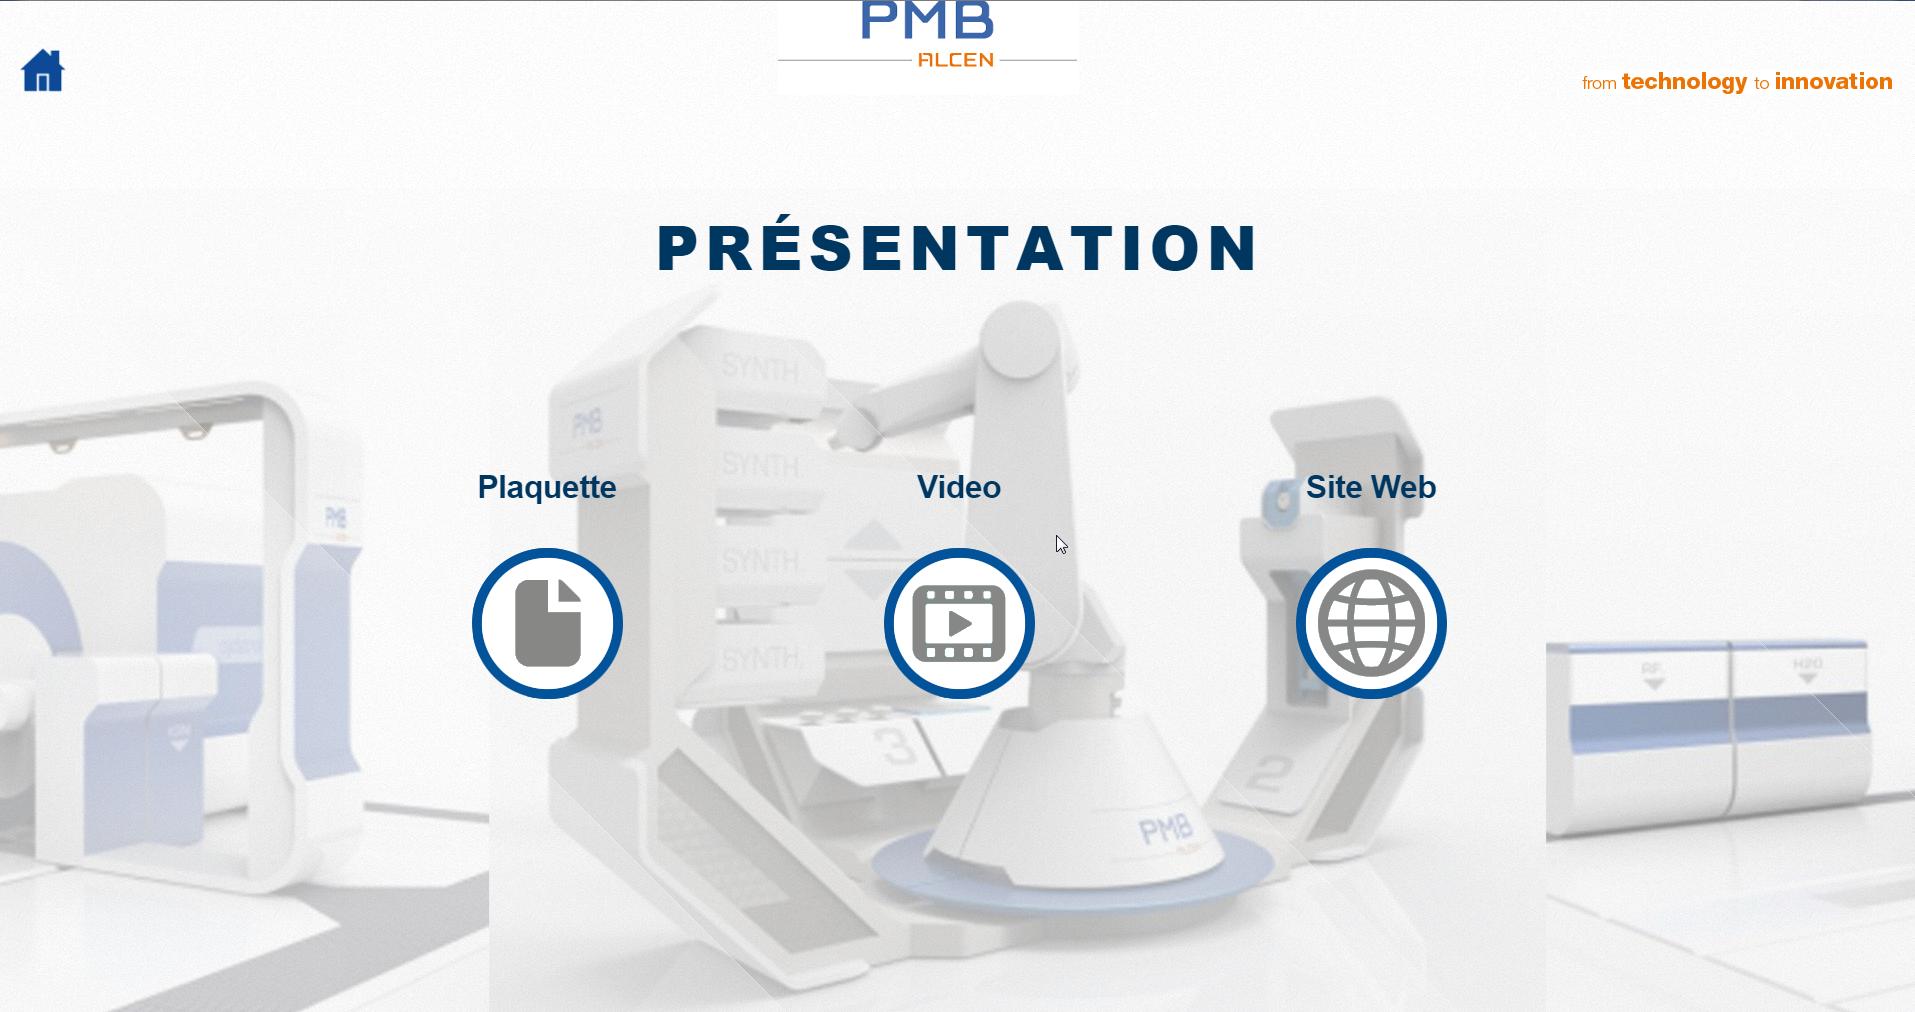
Twist content in use - Infodecor presentation

Who is Twist for?

The application is aimed at all companies exhibiting at trade fairs who want to bring their offering to life. It's also a turnkey, customisable software solution for stand builders and agencies designing presentations for their clients.

Why choose TwisT for your stand?

  1. Tailor-made customisation: our teams integrate your brand guidelines for a result perfectly aligned with your brand identity.
  2. Media centralisation: support for all your content (PDFs, videos, presentations, website) on a single touch interface.
  3. Intuitive navigation: an ergonomic interface designed for immediate use, letting your visitors browse your media smoothly and independently.
  4. Multi-device: full compatibility with touch screens, kiosks, interactive tables and tablets.

Frequently asked questions about TwisT

What does TwisT actually bring to your trade fair stand?

TwisT centralises all your multimedia content (PDFs, videos, slideshows, websites) on a touch interface customised to your brand guidelines. Your visitors browse independently while you collect their data via built-in forms, turning every interaction into a qualified business opportunity.

Does the application need an Internet connection to work on the stand?

No, TwisT runs fully independently on a local Windows machine with a built-in browser, database and embedded PHP engine. This internet independence guarantees reliable operation even in poorly connected areas of large convention centres.

How do you customise the interface to reflect your brand identity?

Our technical teams integrate your complete brand guidelines: colours, typography, logo and navigation structure. You get an application in your company's colours, a true digital extension of your visual identity on the stand.

Is visitor data collection compatible with your existing CRM?

Yes, TwisT exports forms and guest lists to structured Excel files ready to import into your CRM. You can also configure automated exports via email or a direct link, depending on the complexity of your business ecosystem.

What hardware is compatible for deploying TwisT?

The application is compatible with touch screens, interactive kiosks, digital tables and tablets running Windows. A-Loc also supplies all the audiovisual equipment needed (screens, touch panels, computers) for rental, as a turnkey package.

How long does it take to design and deploy a custom TwisT application?

Implementation generally takes a few days depending on complexity: integrating your content, creating forms, graphic customisation. We deliver a ready-to-use solution with technical support available during your event if needed.

A-Loc Analytics: footfall and visitor flow analysis tool for your stand

Measure your stand's footfall with a detailed breakdown of your visitor flow

At the end of a trade fair, assessing its success and your stand's footfall too often relies on vague impressions or rough guesses: "We had a lot of people... at times it was a bit quiet..." It's rarely more precise, and it gives you nothing concrete to optimise your team's presence at future editions or to report back to management.

A-Loc Analytics turns the estimate of your stand's footfall into tangible, actionable data. The system combines wide-angle vision sensors positioned at the various entry points of your stand with specialised AI processing: each pass generates an anonymous digital signature, ensuring counting in strict compliance with GDPR. Number of visitors at a given time, average duration... all this data is presented in tables and charts.

Tailor-made configuration

Before the event, our teams configure the system according to the parameters of your choice: daily time slots, analysis intervals (30 min, 1 h…) and filtering of your team members so they don't skew the metrics. Once installed, the system runs fully autonomously.

Live monitoring and summary reports

During the show, you can check your footfall indicators live from a simple web page, accessible on your stand from a smartphone, tablet or PC: number of unique visitors, cumulative flow, average time spent or occupancy rate at peak footfall. At the end of each day, the solution automatically generates detailed histograms and charts to analyse your visitor flow.

In summary

  • Each pass generates an anonymous digital signature, ensuring counting in strict compliance with GDPR.
  • A-Loc Analytics turns the estimate of your stand's footfall into tangible, actionable data.

Contact us to learn more or to request a demo ahead of your next event.

Frequently asked questions about A-Loc Analytics

How does A-Loc Analytics measure your stand's footfall without collecting personal data?

The system uses a 4K turret camera combined with the YOLOv8 algorithm, which turns each silhouette into an anonymous digital fingerprint (a mathematical vector). No photo is stored, guaranteeing strict GDPR compliance while ensuring accurate counting (>98% reliability).

What key indicators do you get in real time during the event?

The web dashboard, accessible from tablet or smartphone, displays: unique visitors, cumulative visits, average time spent, instant occupancy rate and peak hourly footfall. These KPIs let you adjust your staffing live based on actual footfall.

Can you filter out your own team's movements to avoid skewing the statistics?

Absolutely. Two methods are available: an individual digital signature for each staff member, or an algorithmic filter based on frequency and length of presence (>2h). This way only genuine visitors are counted in your metrics.

How is the data presented for analysing post-show performance?

At the end of each day or of the event, the system automatically generates flow histograms by time slot, cumulative curves, comparative multi-day footfall heatmaps, and CSV logs exportable to Excel, PowerBI or other BI tools for your management reporting.

What technical setup is needed to deploy the AI counting system?

A wide-angle camera pointed at each stand entrance, connected to a local server (preferably via a wired connection). Quick installation before opening; 100% autonomous operation during the trade fair.

How do these metrics improve your ROI and your future negotiations?

You get tangible, hard numbers: real footfall, qualitative interaction time, actionable hourly breakdown. This data supports your investment case with management, helps optimise your floor space for future editions, and justifies your budgets to sponsors.

Contact us to discover our other solutions

Let's talk about your next trade fair and how these solutions can fit into your stand.